
Historical Returns of Gold, Silver, Platinum and Palladium
How have gold, silver, platinum and palladium performed over longer periods of time?
Our return overviews show the historical performance of these four precious metals for different purchase and sale years from 1999 through the end of 2025.
The calculations do not only show the total price change. For each period, the compound annual growth rate (CAGR) is calculated. This makes it easier to compare investment periods of different lengths.
The analyses are shown in both US dollars and euros. For investors in the euro area, this distinction is important because the result is influenced not only by the development of the respective precious metal price, but also by changes in the EUR/USD exchange rate.
Long-term comparison since 1999
Over the entire period shown, from the end of 1999 to the end of 2025, the average annual return in euros was approximately:
- 10.3% for gold
- 9.9% for silver
- 5.8% for platinum
- 4.6% for palladium
These figures apply only to this specific period. Depending on the purchase and sale dates, the results may differ considerably.
The comparison also shows that the four precious metals do not necessarily move in parallel.
Gold shows a comparatively steady positive development over many longer-term periods.
Silver often shows stronger fluctuations and may generate both significantly higher gains and stronger declines over individual periods.
Platinum and palladium also differ considerably from gold. Both metals have experienced phases of strong appreciation as well as longer weaker periods. The choice of entry and exit point is therefore particularly visible in their historical return tables.
2025 in comparison
2025 was an exceptionally strong year for all four precious metals covered.
Compared with year-end prices for 2024, prices in US dollars rose by approximately:
- 67% for gold
- 149% for silver
- 144% for platinum
- 83% for palladium
In euro terms, the increases were somewhat lower due to the development of the EUR/USD exchange rate, but were still very substantial:
- 48% for gold
- 120% for silver
- 116% for platinum
- 61% for palladium
The performance of a single year should not be viewed in isolation. The return overviews demonstrate how strongly the result can change when different purchase and sale years are combined.
The four return overviews
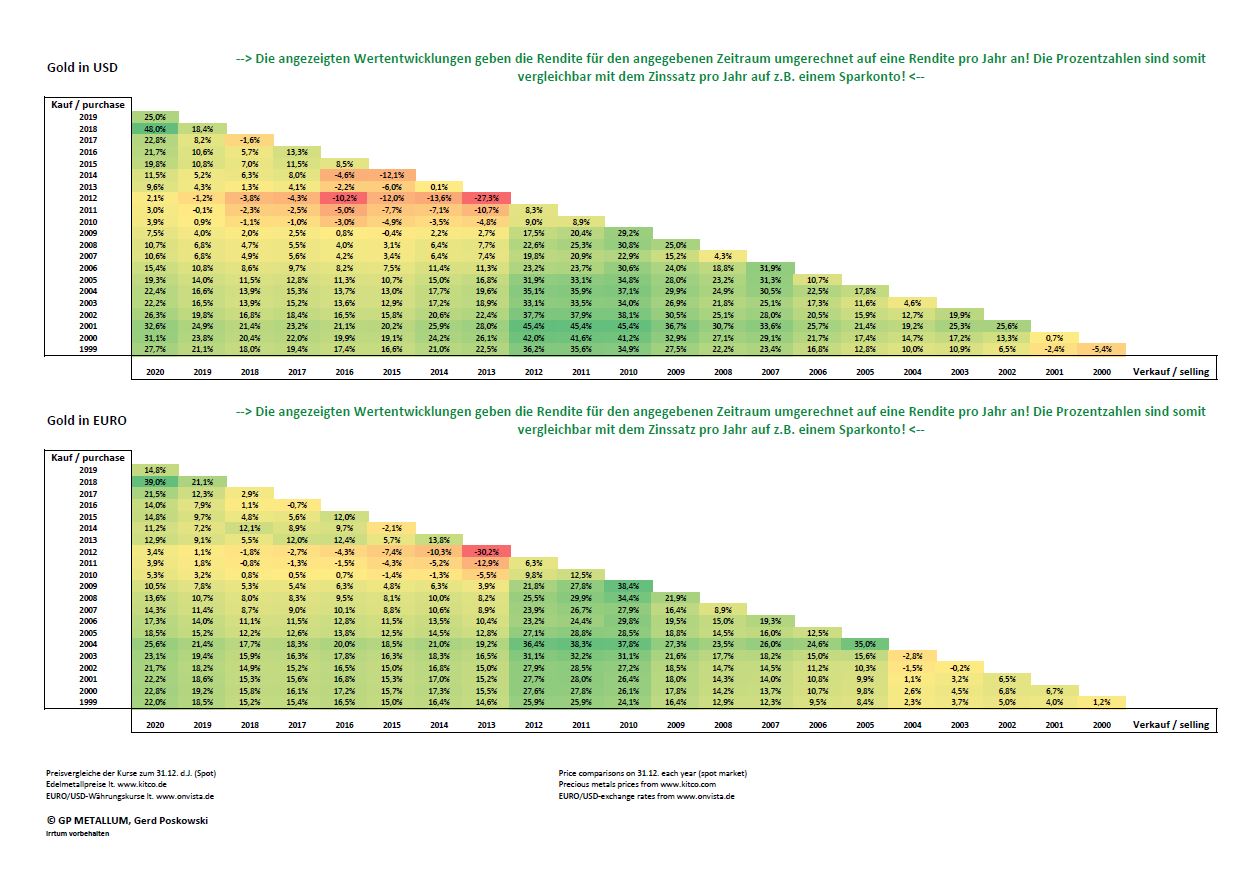
Gold return overview 1999 to 2025
Silver return overview 1999 to 2025
Platinum return overview 1999 to 2025
Palladium return overview 1999 to 2025
The tables show the average annual return between the stated purchase and sale years, both in US dollars and in euros.
Notes on the calculation
The calculations are based on historical year-end prices of the respective precious metals.
They do not take into account individual premiums paid when purchasing, discounts when selling, storage, insurance or other costs, or any possible tax treatment.
The figures therefore show the historical price development of the respective precious metal and not the actual return achievable from an individual purchase.
Past performance does not provide a reliable indication of future price developments. The analyses are provided for general information only and do not constitute individual investment advice.
Data as of: December 31, 2025